
The British countryside is known for its sweeping expanses of vibrant green meadows, hillocks, and woodlands. We have the perfect climate to sustain a beautifully green countryside throughout the entire year.
This raises an interesting question: which English county is the greenest? If you’re looking for greener pastures, to live, work, or holiday, where in England would be the best place to go?
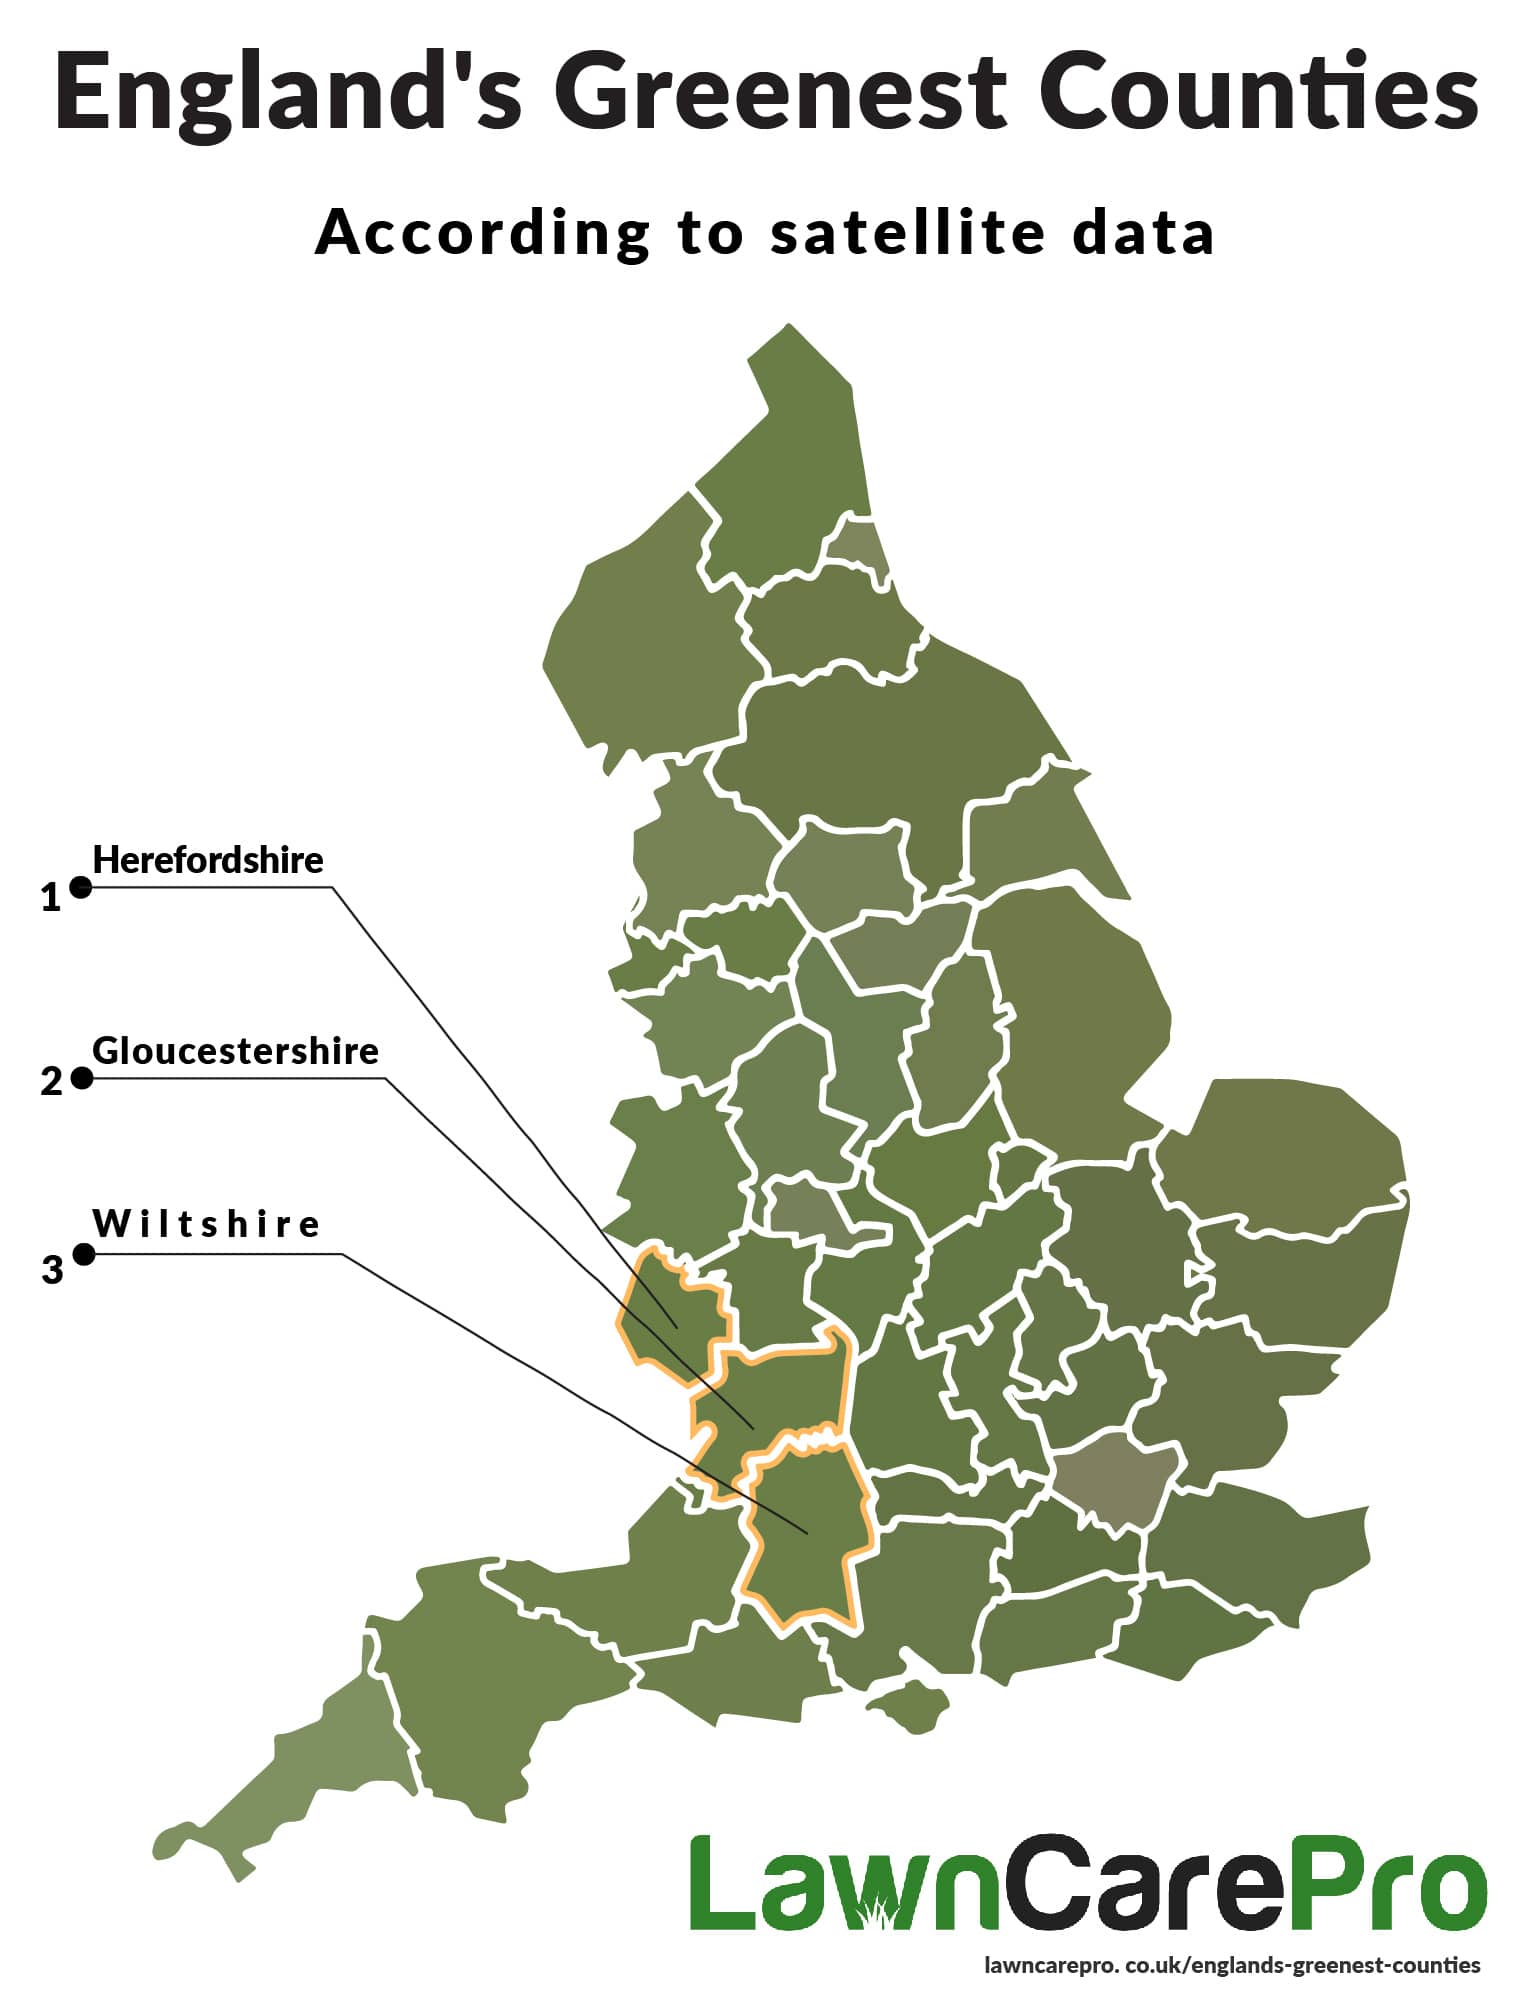
We looked at satellite imagery to find the average colour of each English county, and ranked them based on which county is greenest.

Full data
| Rank | County | Average colour (hexadecimal colour code) | Delta E value (a lower value means that the colour is more similar to grass green) | Percentage difference from county #1 |
|---|---|---|---|---|
| 1 | Herefordshire | #697d45 | 48.2335 | 0.00% |
| 2 | Wiltshire | #6a7e47 | 48.5996 | 0.76% |
| 3 | Gloucestershire | #697d46 | 48.6147 | 0.79% |
| 4 | Shropshire | #6a7f4a | 49.0918 | 1.78% |
| 5 | Warwickshire | #647944 | 49.2015 | 2.01% |
| 6 | Leicestershire | #677a42 | 49.285 | 2.18% |
| 7 | Devon | #72844e | 49.5394 | 2.71% |
| 8 | Worcestershire | #677a45 | 49.7337 | 3.11% |
| 9 | Oxfordshire | #637743 | 49.933 | 3.52% |
| 10 | Somerset | #6f804b | 50.2145 | 4.11% |
| 11 | Northamptonshire | #637744 | 50.3302 | 4.35% |
| 12 | Rutland | #657642 | 50.8081 | 5.34% |
| 13 | Buckinghamshire | #647745 | 51.0038 | 5.74% |
| 14 | Dorset | #6f7f4c | 51.289 | 6.33% |
| 15 | Isle of Wight | #6f7f4c | 51.289 | 6.33% |
| 16 | Cumbria | #717f4c | 51.8634 | 7.53% |
| 17 | Cheshire | #728454 | 51.9589 | 7.72% |
| 18 | East Sussex | #607343 | 51.9604 | 7.73% |
| 19 | Cornwall | #7f9161 | 52.3147 | 8.46% |
| 20 | West Sussex | #667747 | 52.3572 | 8.55% |
| 21 | Staffordshire | #6d7f50 | 52.3664 | 8.57% |
| 22 | Surrey | #5f7040 | 52.636 | 9.13% |
| 23 | County Durham | #6b7846 | 52.6615 | 9.18% |
| 24 | Hampshire | #697848 | 52.8796 | 9.63% |
| 25 | Derbyshire | #6b7e51 | 52.9609 | 9.80% |
| 26 | Berkshire | #647343 | 53.0473 | 9.98% |
| 27 | Northumberland | #6b7644 | 53.3073 | 10.52% |
| 28 | Nottinghamshire | #6e7c4d | 53.4821 | 10.88% |
| 29 | North Yorkshire | #697646 | 53.4986 | 10.92% |
| 30 | Bedfordshire | #667547 | 53.7785 | 11.50% |
| 31 | Lancashire | #758355 | 53.8697 | 11.69% |
| 32 | Lincolnshire | #707a49 | 53.8719 | 11.69% |
| 33 | Hertfordshire | #637245 | 54.3005 | 12.58% |
| 34 | East Riding of Yorkshire | #717d4f | 54.4329 | 12.85% |
| 35 | Kent | #637246 | 54.7143 | 13.44% |
| 36 | Essex | #657146 | 55.9728 | 16.05% |
| 37 | Norfolk | #707749 | 55.9757 | 16.05% |
| 38 | Suffolk | #707749 | 55.9757 | 16.05% |
| 39 | West Yorkshire | #758157 | 56.0784 | 16.26% |
| 40 | Cambridgeshire | #647147 | 56.1207 | 16.35% |
| 41 | West Midlands | #768159 | 57.1982 | 18.59% |
| 42 | South Yorkshire | #747e56 | 57.4662 | 19.14% |
| 43 | Bristol | #838b62 | 57.7353 | 19.70% |
| 44 | Greater Manchester | #7a855f | 58.0992 | 20.45% |
| 45 | Tyne & Wear | #7f855d | 58.5779 | 21.45% |
| 46 | Greater London | #7e805f | 59.1491 | 22.63% |
| 47 | Merseyside | #8a8b6a | 63.0008 | 30.62% |
Our comments
What fascinated us about our findings was how close the top three greenest counties were to one another. The difference between first and second place was just 0.76%. In fact, each county in the UK is very green, with the exception of a few highly urbanised areas, such as Greater London.
Herefordshire took out the number one spot, as the majority of the county is used for agriculture, with just a few small towns adding to its overall population. Wiltshire, one of England’s most historical counties, ranked in second place, with plenty of arable agricultural areas. The county that came in third place, Gloucestershire, has a higher population, and a larger number of towns, but also takes up a larger area, including much of the Cotswolds, and the Avon Green Belt.
When it comes to the bottom of the rankings, we were surprised to see that Greater London did not end up in last place. Instead, despite the green areas around Knowsley Park and Thornton, we found Merseyside to be the least green county in England at the moment. The main reason for this was the fact that Merseyside had many areas of brown, according to our satellite imagery, such as along the coast, and the River Mersey. On the other hand, Greater London was mostly made up of the colour grey, with some areas of green, especially in the south. Using the Delta E method to analyse colour differences, brown is further away from green than grey, which is part of the reason why Merseyside was found to be less green.
Ultimately, if you’re looking to live, work, or holiday somewhere green this spring, the south-west of England is a great choice. Herefordshire is fantastic if you’re looking for lots of open space, with endless fields full of Hereford beef cattle, while Wiltshire is a better choice if you want to explore pre-Roman archaeology, such as Stonehenge. On the other hand, Gloucestershire is great if you’re looking for a better choice of small towns and villages to explore, and a greater variety of things to do.
Methodology
To find England’s greenest counties, we first found a cloud-free satellite image of the UK, and split the image into 47 different sections, one for each county. We used the ceremonial counties (also known as geographic counties) defined by the government in 1997.
Then, we found the average colour of each county, and sampled this colour to find its red, green, and blue values. Next, we used the Cie76 Delta-E algorithm to calculate the similarity between the county’s colour, and the colour of green grass.
The Delta-E algorithm uses a mathematical formula, which was created by the Commission Internationale de l’Eclairage (International Commission on Illumination). The algorithm is used to measure the distance between two colours, based on how humans perceivethem. This has a wide variety of potential uses, such as calibrating the colour settings of a projector.
We compared each county’s colour to this colour:
which is known as grass green, to compute our Delta-E scores.

I’m Josh, and I’m the head writer at Lawn Care Pro.
I love everything lawns, but I’m a bit of a lawn mower nerd. I spend a lot of my free time tinkering with mowers, and planning my mowing schedule for the next few weeks.
I’m also into cars, which comes in very helpful when servicing a mower engine!